Track support and sales performance
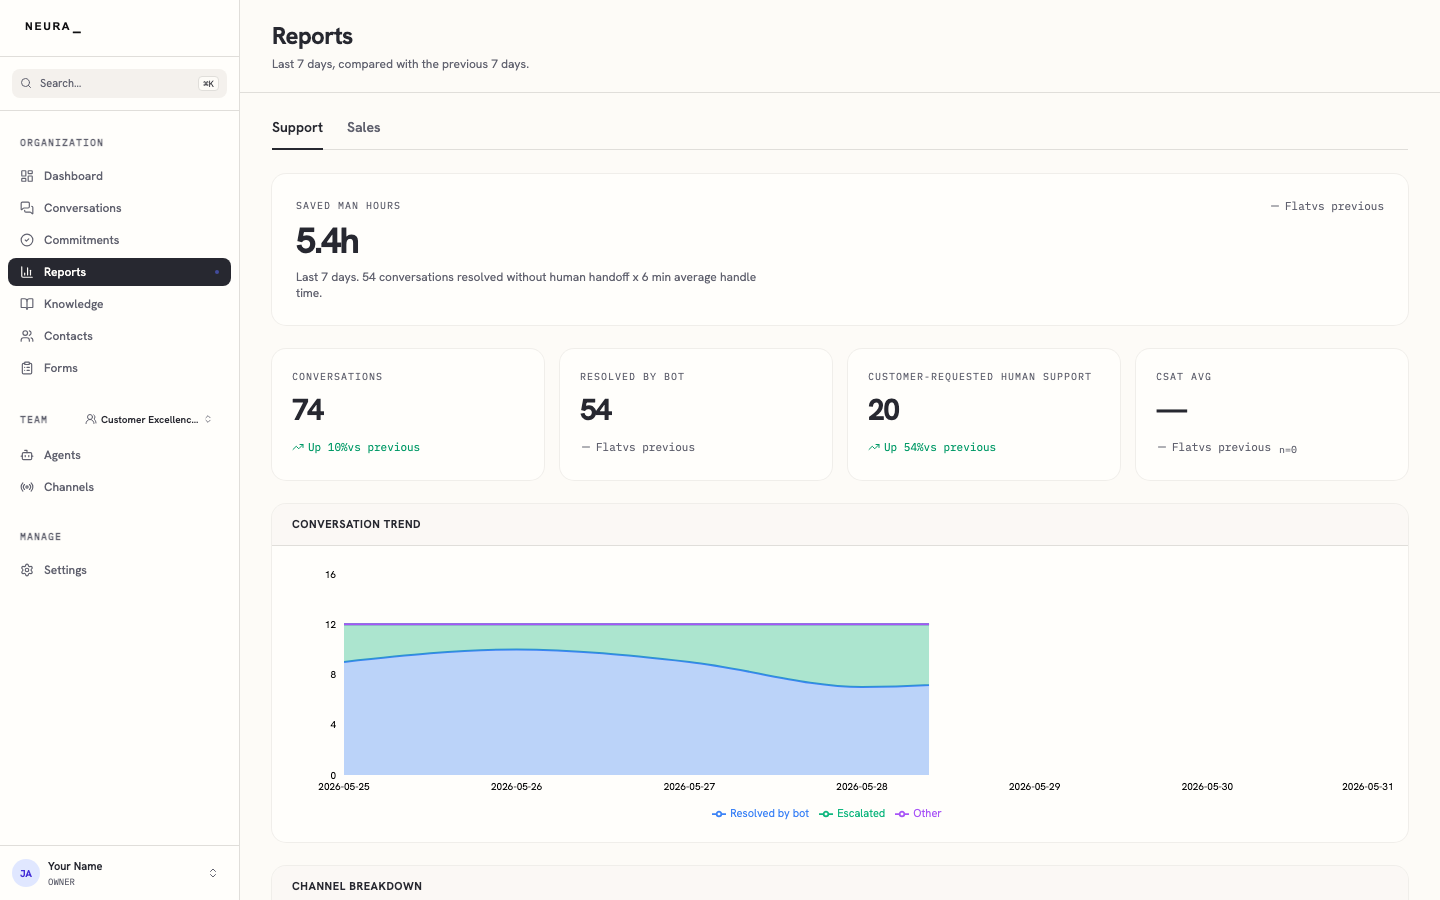
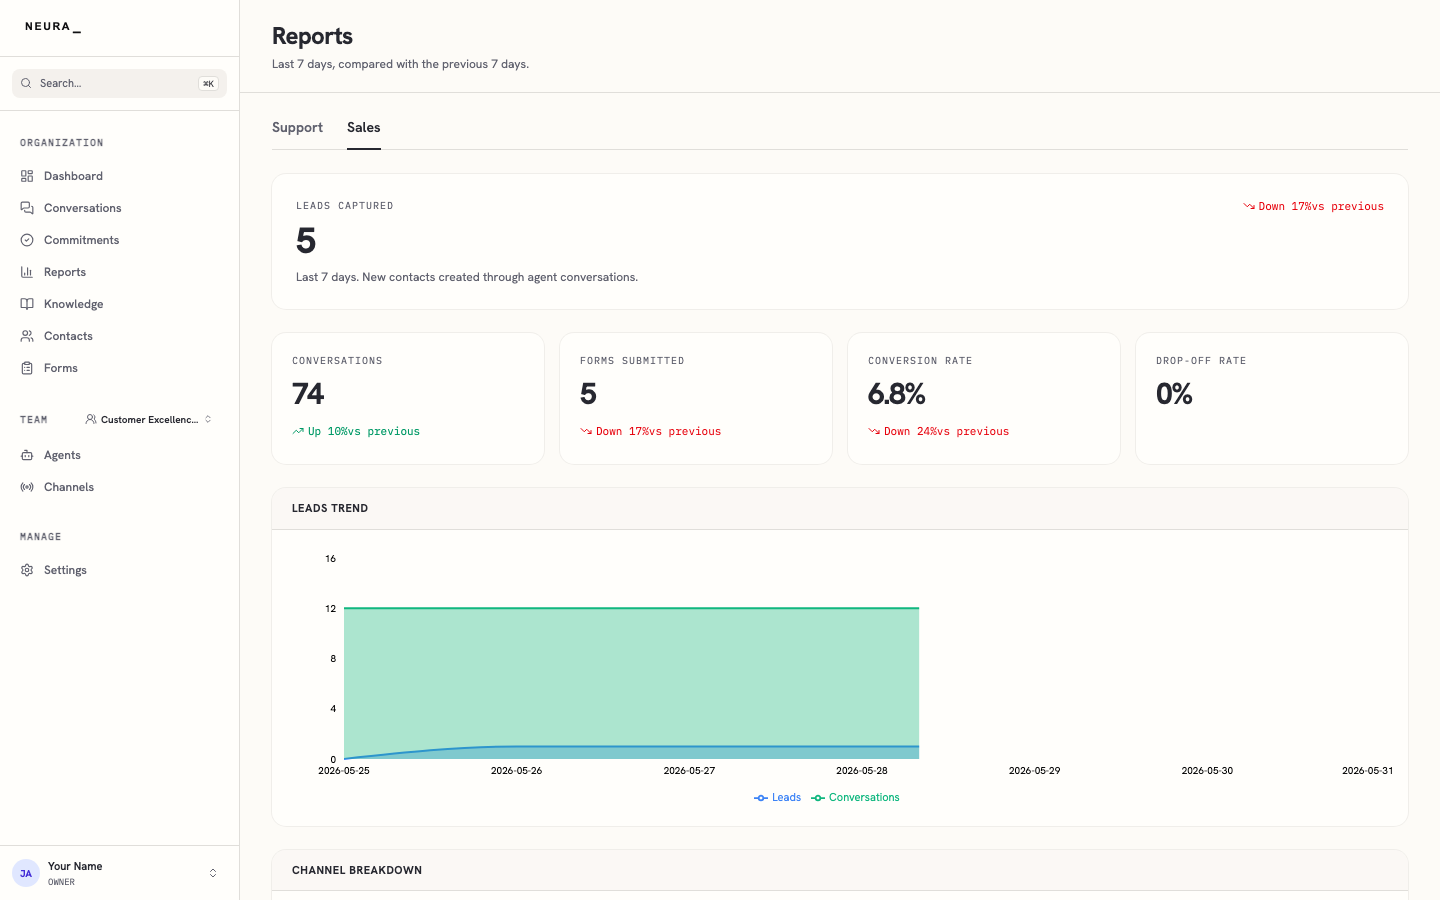
Reports turn your conversations into numbers you can act on. The Support report shows how well chats are being resolved and how fast, while the Sales report shows leads captured and how they are progressing. Each report uses the same pattern of summary cards and trend charts, with the time window shown at the top so you know what period you are reviewing.
Before you begin
- You are signed in to Neura.
- Your workspace has recorded some conversations and outcomes.
Steps
- Open Reports from the left sidebar.
- Review the Support report to see summary cards and trends for support activity, including resolution, response time, and conversation volume.
- Select Sales to switch to the sales report and view lead and pipeline metrics.
You’ll know it worked when
You can read your support and sales numbers at a glance and spot trends week over week to see what is improving and what needs attention.