Take a tour of your dashboard
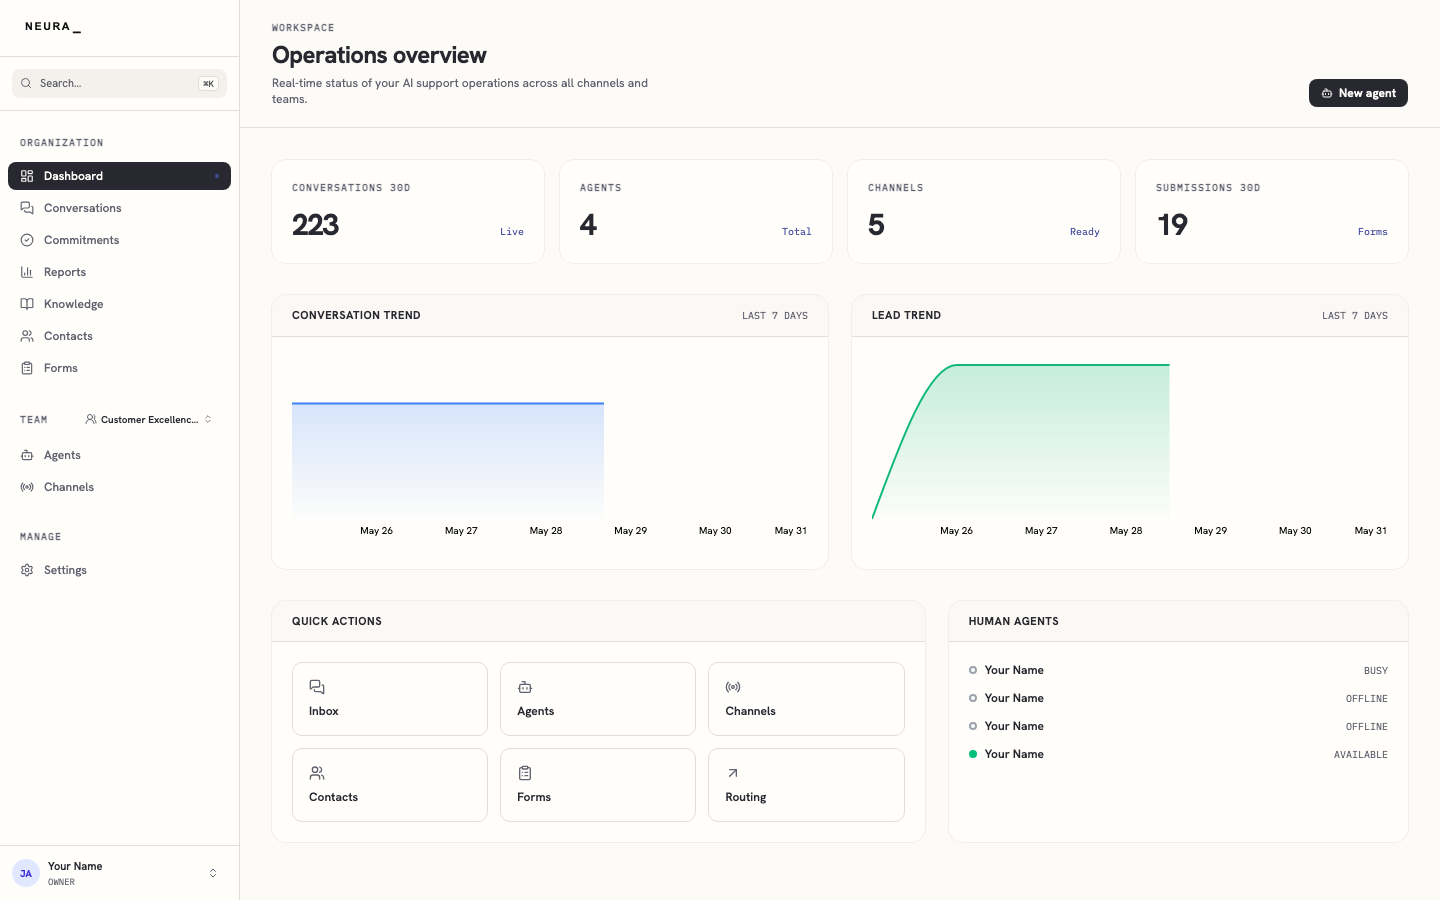
The dashboard is the first thing you see after signing in, and it gives you a quick picture of how your workspace is performing. It brings together your recent conversation volume, the number of agents and channels you have set up, form activity, trend charts, and which human agents are currently available. Use it when you want to check the health of your support or sales operation without opening each area one by one.
Before you begin
- You are signed in to Neura.
- If you need help signing in, see Log in.
Steps
- Open Dashboard from the left sidebar.
- Wait for the trend cards to finish loading.
- Review the Operations overview page to check your top summary cards, the CONVERSATION TREND and LEAD TREND charts, the QUICK ACTIONS shortcuts, and the HUMAN AGENTS list.
You’ll know it worked when
You can read your operation’s health at a glance — recent activity, trends, and who’s available — and jump to any area from the quick links.